The Waived Fees page provides an overview of the channel volume and volume distribution data included in the following three pages. This data includes:
 |
If an institution does not waive or report waived fees, waived fee information does not appear within the Profitability Analysis Presentation. |
Volume by Channel Open Account
The Volume by Channel Open Account page displays two double bar graphs that illustrate the open account volume and volume distribution per channel. The graph on the left of the page compares the open account volume for the current quarter to the same quarter in the previous year. The graph on the right of the page compares open account volume distribution for the current quarter to the same quarter in the previous year.
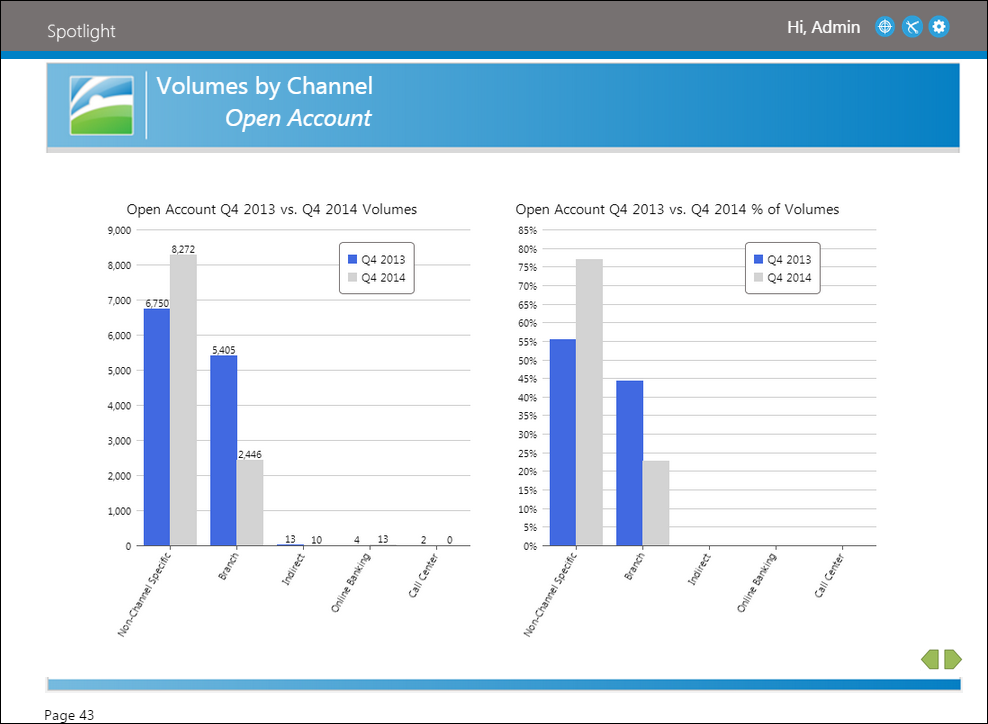
The x-axis indicates the channels included in the comparison. The y-axis indicates the open account volume. Within the graph, two bars indicate the volume.
- The blue bar represents the prior quarter.
- The grey bar represents the current quarter.
|
The cumulative volumes identified in the % of Volumes graph total to 100%. |
Volume by Channel Process Transaction
The Volume by Channel Process Transaction page displays two double bar graphs that illustrate the transaction volume and volume distribution per transaction type. The graph on the left of the page compares the transaction volume for the current quarter to the same quarter in the previous year. The graph on the right of the page compares transaction volume distribution for the current quarter to the same quarter in the previous year.
![]()
The x-axis indicates the transaction types included in the comparison. The y-axis indicates the transaction volume. Within the graph, two bars indicate the volume.
- The blue bar represents the prior quarter.
- The grey bar represents the current quarter.
|
The cumulative volumes identified in the % of Volumes graph total to 100%. |
Volume by Channel Close Account
The Volume by Channel Close Account page displays two double bar graphs that illustrate the close account volume and volume distribution per channel. The graph on the left of the page compares the close account volume for the current quarter to the same quarter in the previous year. The graph on the right of the page compares close account volume distribution for the current quarter to the same quarter in the previous year.
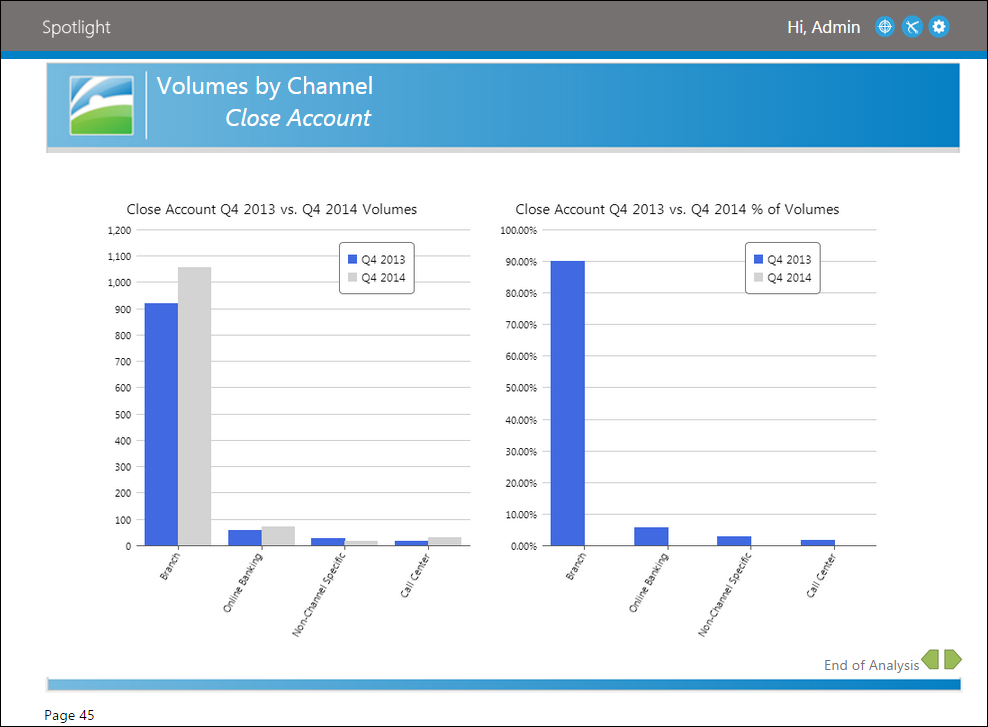
The x-axis indicates the channels included in the comparison. The y-axis indicates the close account volume. Within the graph, two bars indicate the volume.
- The blue bar represents the prior quarter.
- The grey bar represents the current quarter.
|
The cumulative volumes identified in the % of Volumes graph total to 100%. |
 |
The Volume by Channel Close Account page is the final page in the Profitability Analysis Presentation. Clicking  navigates users to the Profitability Analysis Presentation selection screen. navigates users to the Profitability Analysis Presentation selection screen. |